
Long Legs, Short Torso? How to Check Your Body Proportions
Same height, different proportions? Choose a leg-length measurement, follow clear steps, and understand what the research chart can tell you.
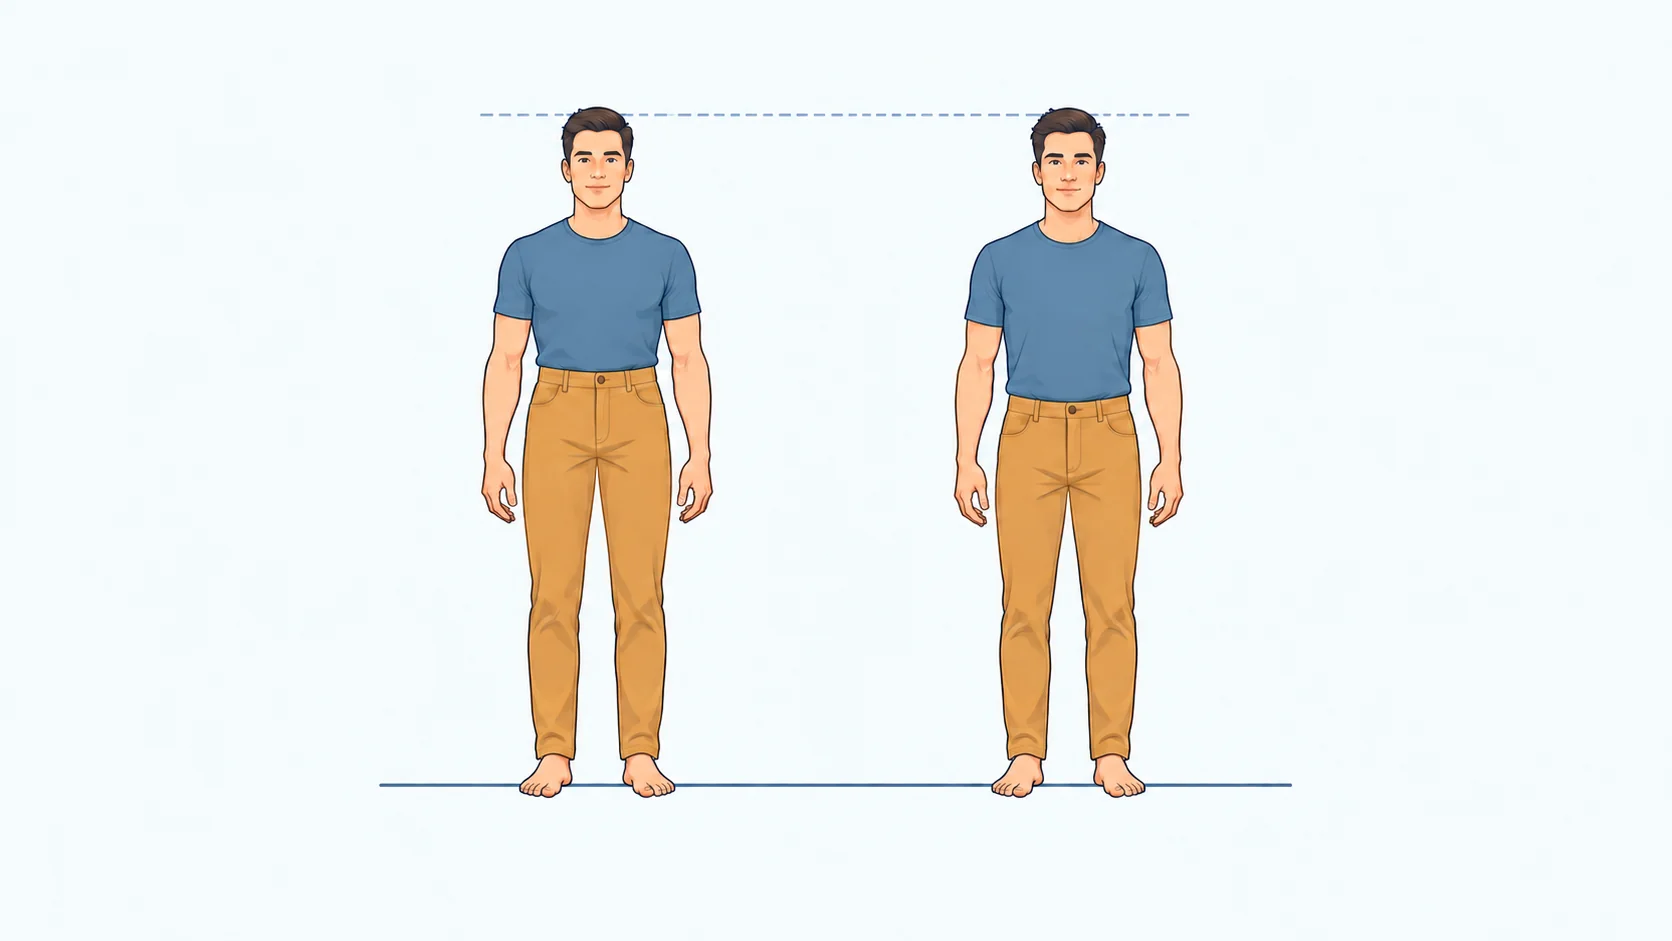
Two people can be the same age and height yet have different proportions. One may have a greater share of their height in the legs, while the other sits taller on the same seat. Standing height tells you the total, but not how it is distributed.
To check your proportions, start with what you want to compare: hip-to-floor height, the standing-and-sitting measurements used in the research chart, or trouser inseam.
Choose the measurement that answers your question
- Hip-to-floor proportions: use the direct measurement, from a defined front hip-bone point vertically to the floor.
- Research chart or seated comparison: use the standing and sitting method. Subtract sitting height from standing height.
- Trouser fit: use the garment inseam measurement, along the inner seam from crotch to hem.
Use the same method for everyone you compare. The Dutch chart below uses standing height minus sitting height; hip-to-floor and inseam measurements cannot be used with it.
What does long legs, short torso actually mean?
Long legs, short torso describes proportions, not a fixed number of centimeters. A shorter person can have a greater leg-length share even when a taller person's legs are longer. Long torso and short legs describes the opposite balance.
Waistbands, garment cut and camera angle can change how long your legs look. Measurements give you a comparison you can repeat. Sitting height includes your head and neck as well as your upper body, so it cannot tell you torso length alone.
How to measure hip-to-floor height directly
For a direct hip-to-floor comparison, measure vertically from a defined hip-bone landmark to the floor. ISO 7250-1:2008, section 4.1.6 calls this standing iliac-spine height.
Use the anterior superior iliac spine (ASIS), the bony projection at the front end of the pelvis's upper rim. The OpenStax anatomy guide shows how it differs from the curved iliac crest above it. Do not start from a waistband or the highest point at the side of your waist.
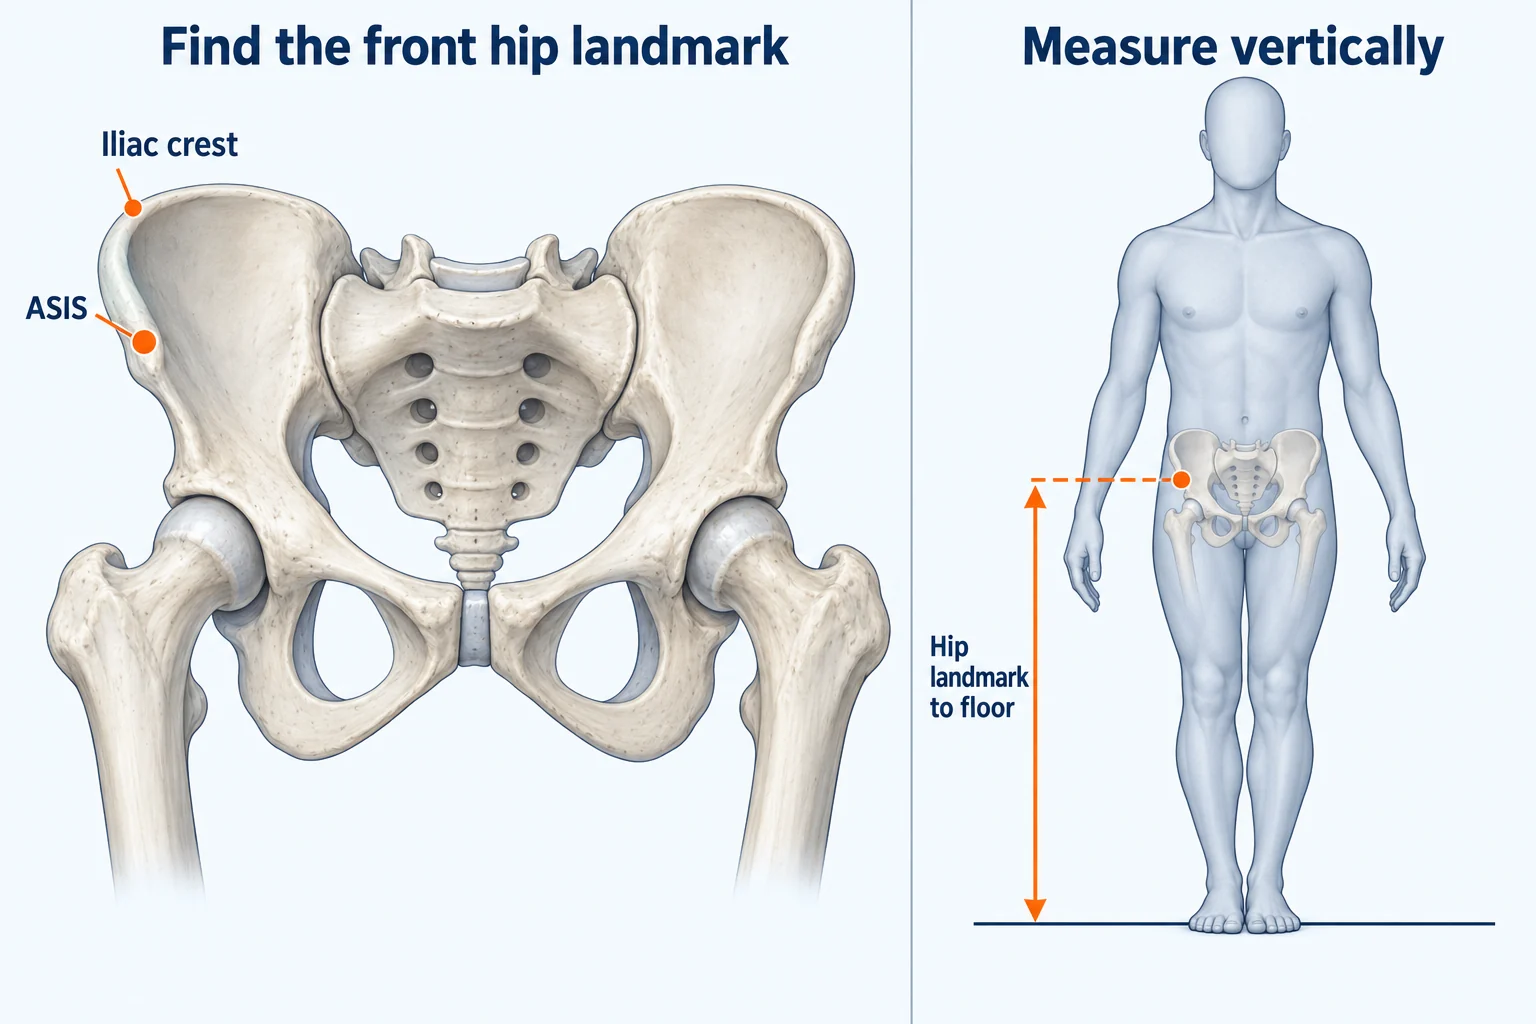
Locate the landmark, then measure vertically
The NIST-hosted measurement procedure, item 73 uses an anthropometer: a vertical measuring instrument with a horizontal arm. If you cannot identify the landmark confidently, ask a trained measurer to locate it.
- Mark the downward-directed tip of the ASIS specified by the ISO definition. Record which side you measure.
- Stand barefoot on a firm, level floor with your feet together, weight evenly shared and both heels down.
- Hold the anthropometer vertical and bring its horizontal arm to the mark. Read the height from the floor; do not run a tape along the skin or diagonally toward the ankle.
A helper can approximate the setup with a vertical scale and a level horizontal guide, though this home adaptation has no validated error margin. Reset your stance for three readings, then record the average and range. These repeats are our practical recommendation; they cannot correct a misplaced landmark.
Formula: Iliac-spine height ratio (%) = iliac-spine height ÷ standing height × 100
This hip-to-floor measurement spans the thigh and lower leg, plus foot height and part of the pelvis. It does not measure individual leg bones. Compare results only when the landmark and procedure match.
How to measure derived leg length using standing and sitting height
For the research chart or a standing-versus-seated comparison, measure standing height and sitting height, then subtract. Sitting height runs from the seat to the top of the head. The steps below adapt CDC's NHANES III procedures, sections 3.3.1.2–3, for home use; they do not reproduce its calibrated equipment or trained examination.
Set up once for both measurements
Ask a helper to measure you. Use a metal tape, a rigid book or set square, a flat wall without a projecting baseboard, and a hard, level stool on a firm floor. Remove shoes and bulky hair accessories. Avoid cushions or thick clothing beneath you, and take both measurements in the same session.
Look straight ahead in both positions. Keep the line from the ear opening to the lower bony rim of the eye socket approximately horizontal. This head position is called Frankfort in the CDC anthropometry manual, section 3.4.3.
Step 1: floor to head
- Stand upright with your feet flat and weight evenly shared. Keep the head position above; do not press your head or back against the wall if it changes your posture.
- Stand tall and take a deep breath. Your helper holds the book level on your crown, flattening the hair, with its edge at a right angle to the wall. Mark the book's lower edge, then measure vertically from the floor to the mark.
Our height measurement guide explains this setup further.
Step 2: seat to head
- Sit upright with your back and buttocks against the wall, knees forward and arms relaxed. For this home setup, rest your feet on the floor or a stable footrest without pushing yourself upward.
- Keep the same head position, sit tall and take a deep breath. Have your helper hold the book level on your crown and mark its lower edge. Measure vertically from the hard seat surface to the mark. If you measure from the floor, subtract the stool height.
Example: on a 45 cm stool, a seated head mark 131 cm above the floor gives a sitting height of 131 − 45 = 86 cm. At a standing height of 170 cm, derived leg length is 170 − 86 = 84 cm.
Step 3: repeat and record
Reset your position for three readings of each measurement, then record the averages, ranges and setup. This is a home consistency check, not an NHANES rule. Check posture, book angle and the seat first: averaging cannot correct a setup error. If the difference between people is similar to the variation in your readings, remeasure before drawing a conclusion.
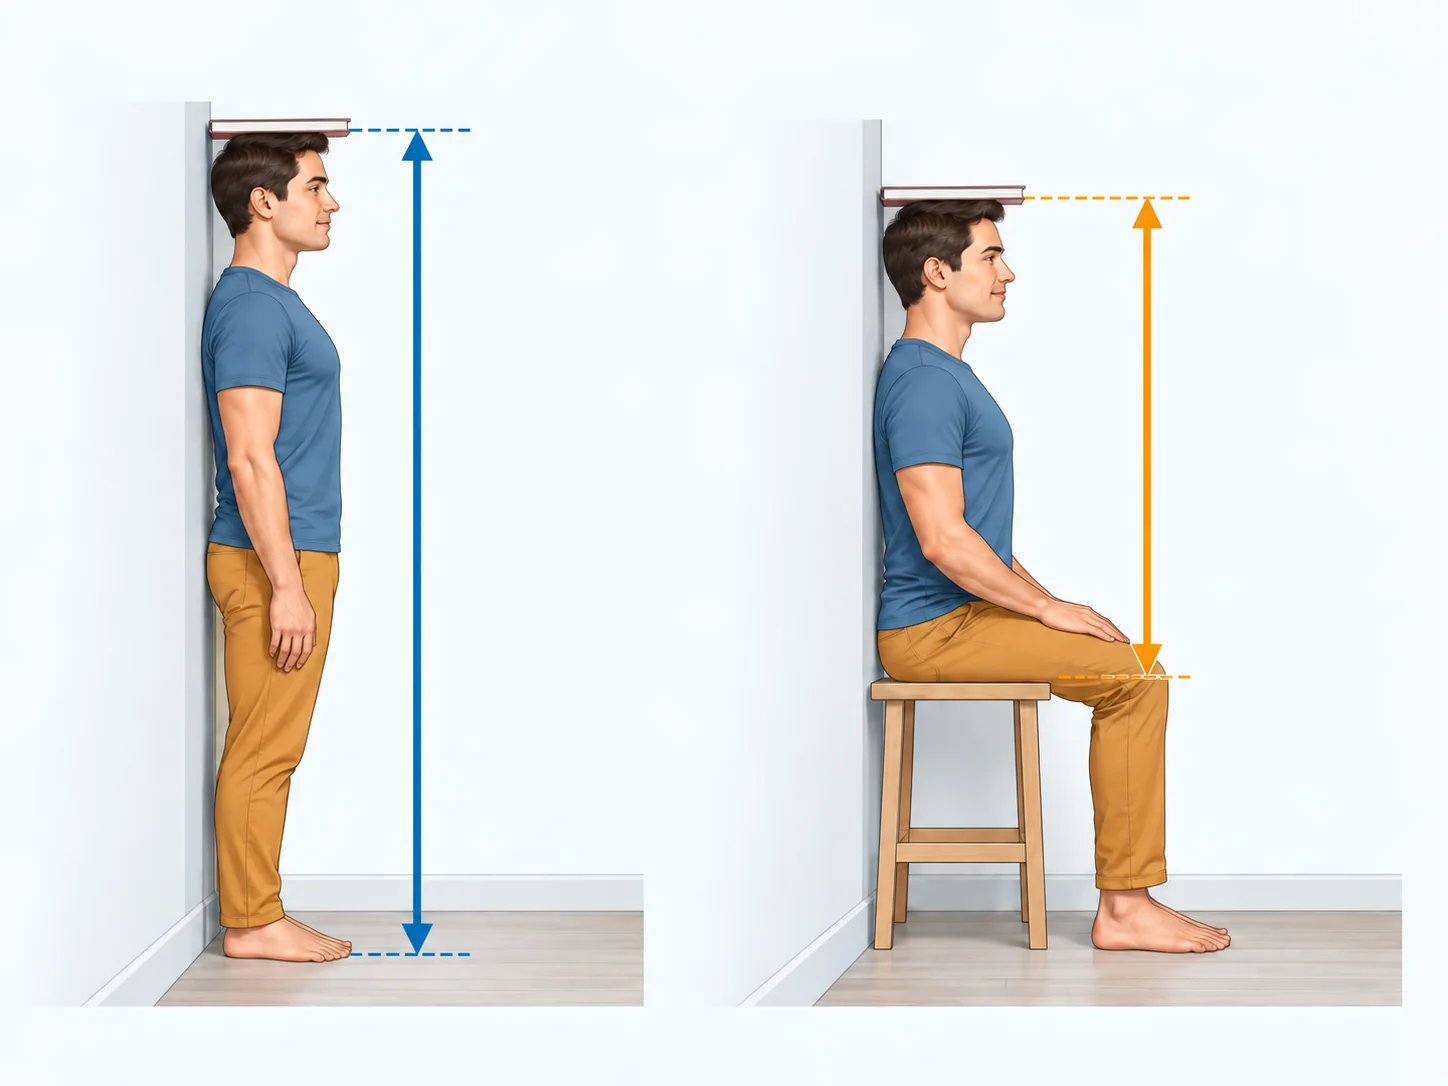
Leg length to height ratio: calculate it without mixing definitions
For the standing-and-sitting method, use these two calculations:
Formula: Derived leg length = standing height − sitting height
Formula: Derived leg length ratio (%) = (standing height − sitting height) ÷ standing height × 100
What counts as a normal leg-to-body ratio?
There is no single percentage here that labels everyone as long-legged or short-legged. A useful reference must match your measurement definition, age, sex and population. The chart below is one historical reference, not a personal body-type label.
Research reference: derived leg length by age and sex
This chart shows standing height minus sitting height, as a percentage of standing height.
The data come from Fredriks and colleagues, based on a Dutch-origin sample measured in 1996–1997. The chart displays ages 2–18. It is a historical age-and-sex reference, not a current worldwide average.
Dutch-origin sample · Ages 2–18 · Survey 1996–1997
Leg length here = standing height − seat-to-head sitting height.
Age 18. Boys median 48.5%. Girls median 47.6%.
Derived leg length / standing height (%)
Historical Dutch reference medians, not individual growth predictions. P3–P97 shows the central 94% of the reference distribution.
Data table 17 ages · 2 sexes
| Age | Boys | Girls | ||
|---|---|---|---|---|
| Median (P50) | P3–P97 | Median (P50) | P3–P97 | |
| 2 yrs | 39.6% | 36.2–44.1% | 39.9% | 36.3–44.6% |
| 3 yrs | 42.8% | 39.6–46.9% | 43.2% | 39.8–47.5% |
| 4 yrs | 44.5% | 41.4–48.5% | 44.7% | 41.5–48.8% |
| 5 yrs | 45.4% | 42.5–49.1% | 45.4% | 42.4–49.1% |
| 6 yrs | 45.9% | 43.2–49.4% | 45.9% | 43.0–49.5% |
| 7 yrs | 46.4% | 43.8–49.7% | 46.4% | 43.7–49.7% |
| 8 yrs | 46.9% | 44.4–50.1% | 46.9% | 44.3–50.0% |
| 9 yrs | 47.5% | 45.1–50.5% | 47.4% | 45.0–50.4% |
| 10 yrs | 48.0% | 45.7–50.9% | 47.8% | 45.3–50.9% |
| 11 yrs | 48.4% | 46.2–51.1% | 48.1% | 45.7–51.0% |
| 12 yrs | 48.7% | 46.5–51.4% | 48.4% | 46.0–51.3% |
| 13 yrs | 49.1% | 46.9–51.8% | 48.4% | 46.0–51.3% |
| 14 yrs | 49.2% | 46.9–52.0% | 48.2% | 45.8–51.1% |
| 15 yrs | 49.0% | 46.7–51.8% | 47.8% | 45.4–50.7% |
| 16 yrs | 48.8% | 46.4–51.7% | 47.6% | 45.2–50.6% |
| 17 yrs | 48.7% | 46.3–51.6% | 47.6% | 45.2–50.6% |
| 18 yrs | 48.5% | 46.0–51.6% | 47.6% | 45.2–50.6% |
Source & methodology
Fredriks et al. (2005), Table 1, p. 810 . DOI 10.1136/adc.2004.050799. The original Dutch-origin sample was measured in 1996–1997. Sitting height was measured in 6,877 boys and 6,202 girls aged 0–21; these are whole-study counts, not per-age counts.
SH/H = M × (1 + L × S × z)^(1/L), where z is the standard-normal quantile. Subtracting from 1 reverses the percentiles: leg-ratio P3 = 100 × (1 − sitting-ratio P97). Values are calculated from published, rounded LMS parameters and displayed to one decimal place.
P3–P97 is the central 94% of the fitted reference distribution, not a confidence interval or a diagnostic threshold. The curves are cross-sectional references, not individual growth predictions. The circular view uses the median leg ratio and its sitting-height complement, not two independently averaged measurements.
At age 18, the derived median is 48.5% for boys and 47.6% for girls, with substantially overlapping reference ranges. The curves group people by age and sex without holding standing height fixed. They are therefore not a distribution for people of the same age and exact height.
The derived leg-length share rises through much of childhood, then levels off or falls during adolescence. A falling share does not mean legs shrink: total height and its components can grow at different rates. The chart compares age groups; it does not predict one child's growth.
Before comparing these results with another study, check the measurement definition, age, sex and survey population. Compare means with means and medians with medians. Reading a curve by eye is not enough to assign yourself an exact percentile.
Same height, different leg length: a worked example
Here is an invented example of two adults who are both 170 cm tall. Their standing and sitting measurements show how equal height can conceal different proportions.
| Measurement | Person A | Person B |
|---|---|---|
| Standing height | 170 cm | 170 cm |
| Sitting height | 86 cm | 92 cm |
| Derived leg length | 84 cm | 78 cm |
| Sitting height ratio | 50.6% | 54.1% |
| Leg length to height ratio | 49.4% | 45.9% |
To compare your own proportions, enter your standing heights and measured seat-to-head values in the sitting height comparison tool. Choose Measured, then switch between Standing and Seated. Automatic estimates show reference proportions; use actual measurements to compare your own proportions.
Inseam vs. leg length: measure trousers for fit
For trouser fit, measure a pair that already fits well. Follow the inner seam from crotch to hem, as shown in Levi's jeans measurement guide. This is garment inseam. Outseam runs from waistband to hem and includes the garment's rise.
A retailer's body-measurement chart may use a different endpoint, such as the ankle. Follow that chart and label your result accordingly. Keep garment inseam and body measurements separate from the derived-leg-length reference chart.
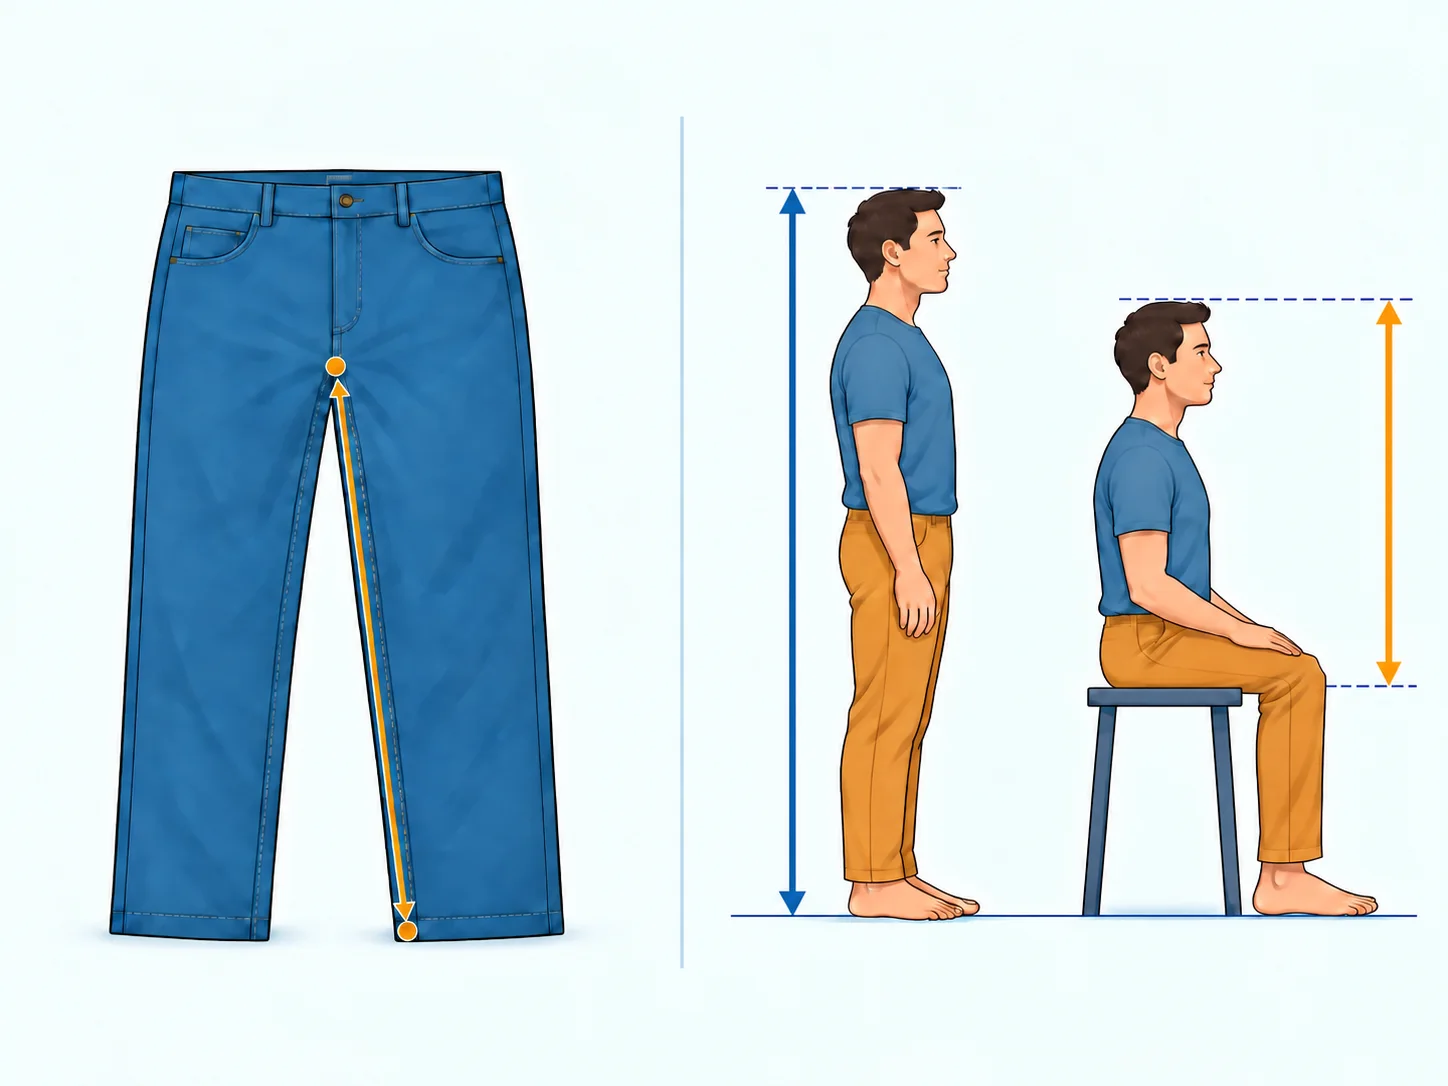
Why short torso, long legs can look different in clothes and photos
A higher waistband can lengthen the visible leg line; a long untucked top can hide where it begins. Camera position and framing also change the impression. Your outfit may look different even though your measurements are unchanged.
If you want a different visual balance, try another waistband position or top length. Compare outfits with the same camera position, footwear and posture. Our explanation of why some people look taller than they really are covers these effects. Comfort and your preferred appearance are better guides than a rigid styling rule.
Questions about long legs, short torso proportions
Can you have long legs and still be short?
Yes. Relative leg length is a share of your own height. Someone shorter can have a larger leg-length ratio while someone taller has longer legs in centimeters.
Does measuring from the hip to the ankle give the same result?
No. A clinical tape method measures from the ASIS to the inner ankle bone while lying on the back. It leaves out the foot-to-floor component, so it differs from standing iliac-spine height and derived leg length.
Does a higher sitting-height ratio mean a long torso?
It means more of your height is above the seat, including the head and neck. It cannot identify torso length alone or determine a clothing size.
Can proportions change with age?
Yes. A 2020 study of children's sitting-height ratios examined variation across childhood and puberty. For the separate question of growth, see our guide to healthy growth and height development. HowHeight's automatic sitting-height estimates use adult reference data for ages 18 and older.
Can a calculator determine my leg length from height alone?
No. People with the same height can have different proportions. The sitting height calculator and comparison can visualize measured standing and seated values, but an automatic estimate is not a measurement of your body.